Hi guys, this week I started to read a book that is part of a reading list for the CSP exam. “Extreme Programming - Installed” and I found an interesting chapter about a topic that me and my colleagues were struggling with couple of weeks ago - “What metrics should we use in order to see how the project is progressing? ” Let´s take a look into it…
Ron Jeffries, Ann Anderson and Chet Hendrickson said there are mainly six kinds of metrics that is useful to play attention to in our projects: Resources, Scope, Quality, Time, Tracking and Reporting Scope, Tracking and Reporting Quality. So let´s take a look at each of these metrics.
Resources
Authors of the book defend that we should always keep a track on key resources - planned versus actual. These are number of developers, testers, customers assigned to a project and number of computers in a development, test and production.
Scope
Number of stories over time: how many stories exist, and how many of these are actually accomplished. We can also see how many stories were initially planned vs stories that we have on the backlog at the moment. This metric can give us an idea whether a product owner adds lot of stories or whether he sticks to the initial release scope.
Quality
Here, a simple graphic can be used to show how many automated test cases were run and how many of these were successful.
Time
The core is to track the results of each released plan and discuss the outcome and impact on the project when any functionality was added or removed.
Tracking and Reporting Scope
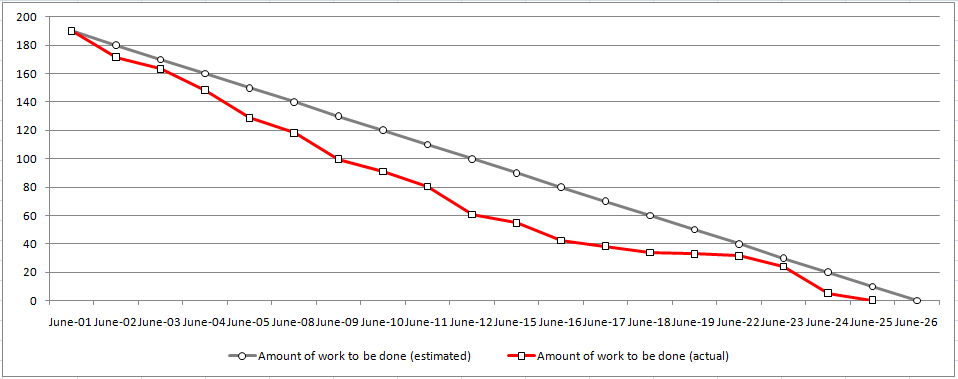
There are two main metrics: Iteration and Release burndown. The iteration burndown chart helps a team to track the iteration work (estimated vs done).
To track how the release is progressing we can use a graphic presented below. The red bar shows the stories that need to be implemented, green bar demonstrates the ones that were already achieved and the yellow ones the stories that were added to the product backlog.
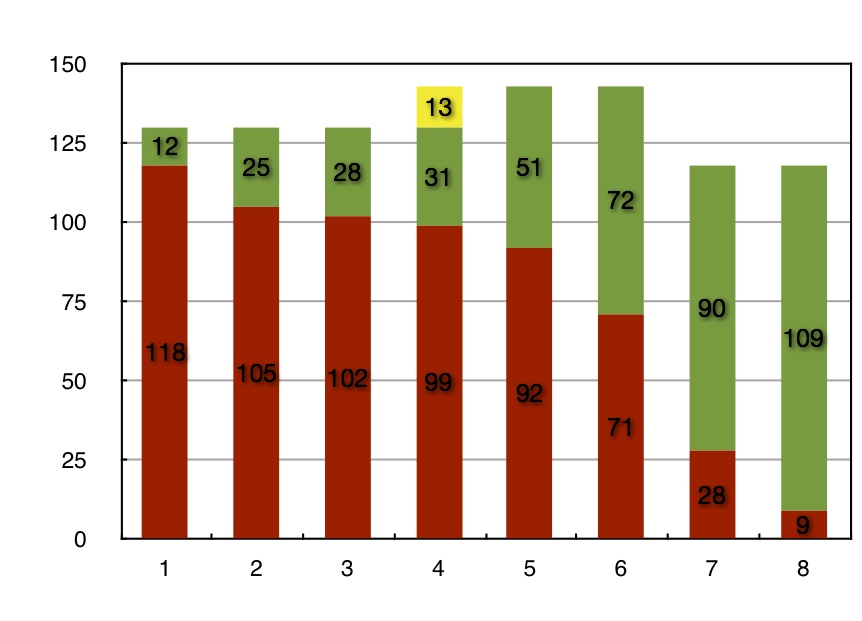
This website serves as a source to a picture displayed above blog You can find more information how to “Read a Release Burndown Chart”.
Tracking and Report Quality
This part describes three interesting metrics. According to the authors, the first metric, that demonstrates the percentage of unit test that passed on an iteration rate, should be available. The number of successful tests tell how well a team is doing. Please, do not take me wrong, this does not mean that teams should not care about having all tests green during the iteration. You should always aim to have it as “green” as possible, but tracking it on iteration level is a good way to see how the team is doing on a release basis. Here you can find more background information to support this statement.
The second metric applies the same thought as mentioned above. However, this time it serves for acceptance and integration tests. Perhaps, in this case, it makes sense to separate the test by product area in order to see which of the product areas are more complicated. Below you can find a report for acceptance testing during an iteration.
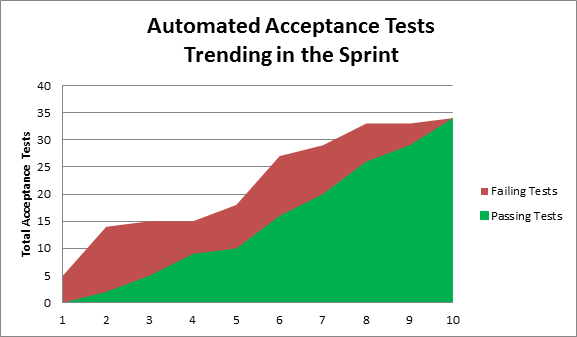
Finally, as a last metric, a comparison matrix - test cases vs date can be used. This would show us which test cases failed and when did it happen. This would allow us to identify any trend that could emerge from there.
Do you think there is anything missing? Please feel free to comment.